$ ./skew-map demo
Options skew, sorted into four quadrants every day
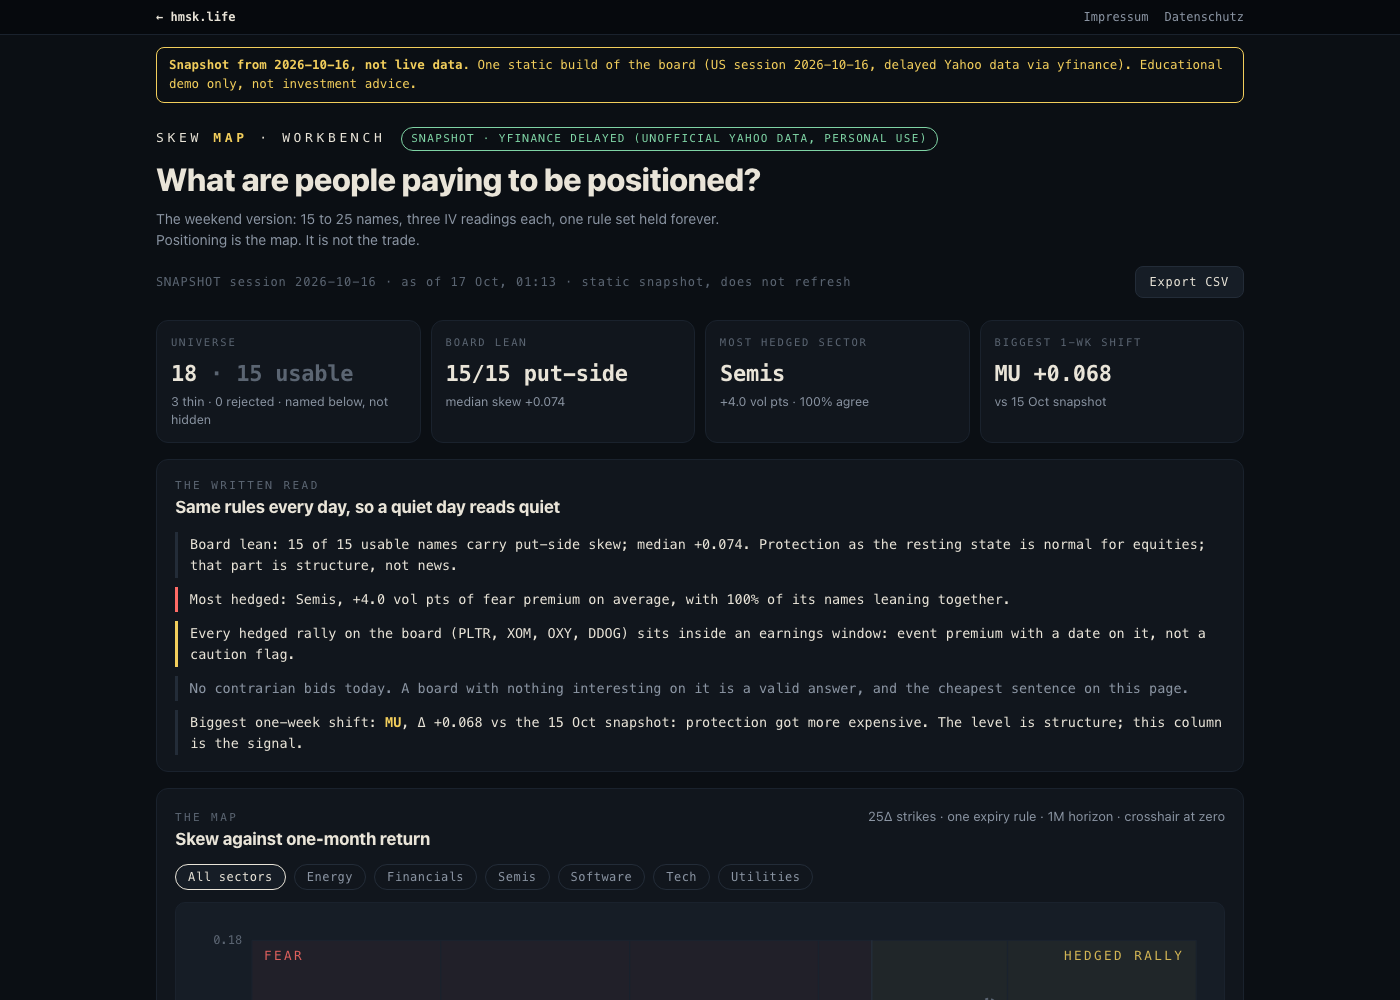
A Python pipeline pulls option chains, computes put/call skew with one fixed rule set and feeds a single-page dashboard. It shows where to look, not what to do.
$ cat features.md
- Pulls option chains for a configurable list of stocks (18 US names by default, grouped by sector) via yfinance, no API key.
- One rule for every name: a 30 to 60 day expiry and 25-delta put and call legs, with implied volatility re-derived from the bid/ask mid.
- Plots skew against the one-month return and sorts names into Contrarian bid, Chase, Hedged rally and Fear, with one fixed-template sentence each.
- Thin chains and odd quotes are flagged on the board, never silently dropped.
- Daily history for week-over-week skew changes and quadrant-flip alerts; all thresholds in one config file, 48 unit tests.
$ cat why.md
I wanted one consistent view of options positioning instead of reading opinions. Fixed rules, the same sentence every day, nothing hidden.
$ self-host-it
- Requirements
- Python 3 (tested with 3.12) with yfinance, pyyaml and requests; any static web server. GitHub Actions workflow included for weekday runs.
- Built with
- Python, static HTML
- License
- MIT
The repository goes public on GitHub soon. Until then, ask me for the code and I'll send you access.
Get the source